Australia’s EM Program
The Australian Fisheries Management Authority (AFMA) implemented Electronic Monitoring (EM) in four Commonwealth fisheries in 2015 to verify logbook data and protected species interaction data collected by fishers. Logbook data is used to conduct stock assessments for the implementation and monitoring of harvest strategies and stock status, and, therefore, access to accurate logbook data is essential for evidence and science-based fisheries management decisions. EM is one of two at-sea monitoring tools, which, like observers, provide valuable independent validation of fishing activities, including validating logbook data. Independent monitoring is an essential component of effective fisheries management and is critical for ensuring confidence in the science underpinning fisheries management decisions. It provides accountability, transparency, and confidence that logbook data is comprehensive and complete. It also ensures confidence in the management arrangements themselves by monitoring compliance with specific management measures.
In pursuing EM, AFMA aimed to investigate the potential for EM to provide an alternative option to onboard, at-sea monitoring by observers. Extensive trials conducted between 2005-2014 demonstrated that EM is an effective tool providing independent, verifiable data. It was shown that EM can be used to validate target catch, effort, interactions with protected species, and the deployment of required mitigation devices. Following these trials, in 2015 AFMA made EM mandatory in the Eastern Tuna and Billfish Fishery (ETBF), the Western Tuna and Billfish Fishery (WTBF), the Gillnet, Hook and Trap Fishery (GHATF), and the Small Pelagic Fishery (SPF).
AFMA’s EM program is built meeting the specific data needs and monitoring objective of each fishery. Different EM data are collected during the review process, depending on the fishery and monitoring objectives under consideration. The footage analysis includes undertaking a full catch composition, in addition to discards, interactions with protected species and deployment of mitigation measures. This EM data is then compared with logbook data and any discrepancies are reported to AFMA. Essential elements of the program include:
- 100% EM coverage, that is, all vessels in these fisheries, above a minimum effort threshold, are required to install an EM system and for it to be functioning 95% of the time
- AFMA applies an audit approach when analysing the collected EM footage, where a random sub-set of the total shots captured in video are selected for review.
- A minimum footage analysis requirement of 10% review of shots per boat with a minimum of one shot per month.
- Review rates may be higher than 10% in specific circumstances, i.e., to meet a specific spatial or temporal management measure or to monitor interactions with specific species. For example, the GHATF requires 100% footage analysis of protected species interactions in areas know to be important for Australian Sealions.
Benefits of EM
AFMA’s EM program has realised and been able to demonstrate benefits in greater flexibility in available at-sea monitoring tools, the accuracy of logbook reporting generally and, in particular, reporting of discards and protected species.
At-sea monitoring
In fisheries where EM has been made mandatory, the use of at sea observers has been fully replaced. Paired trials of observers and EM have demonstrated that the data traditionally collected by human observers has been able to be collected using EM. The well-known and documented exception is biological data. In the four fisheries subject to EM, biological data including lengths, weights, and biological samples (e.g., otoliths) continue to be collected through port sampling and/or crew-based data collection programs.
Logbook data
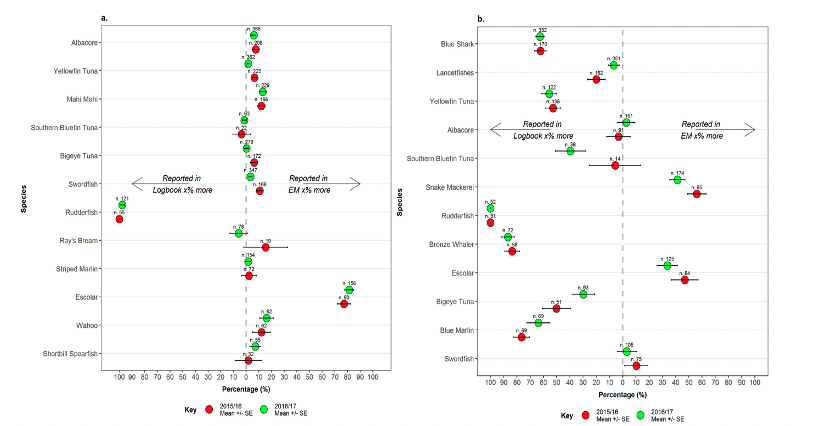
In 2019 the Australian Bureau of Agricultural and Resource Economics (ABARES) independently assessed the congruence between the data generated during the analysis of EM footage with the associated logbook data[1]. The research demonstrated that, based on the weight of evidence, the use of an integrated EM system has resulted in significant changes in logbook reporting of discarded catch and protected species interactions (Figure 1) and improved the accuracy of logbook reporting generally.
Protected species reporting
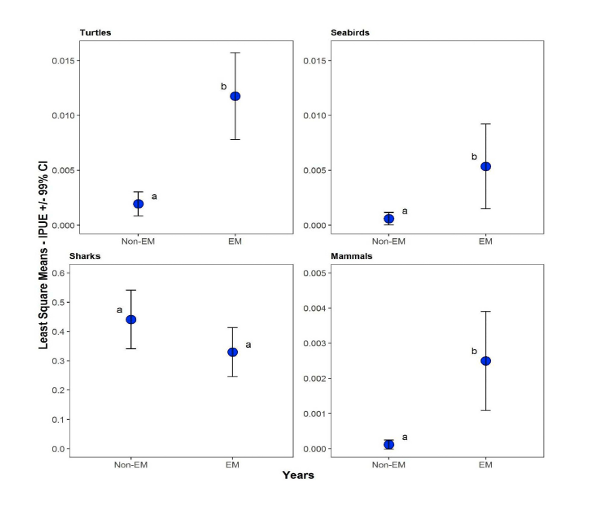
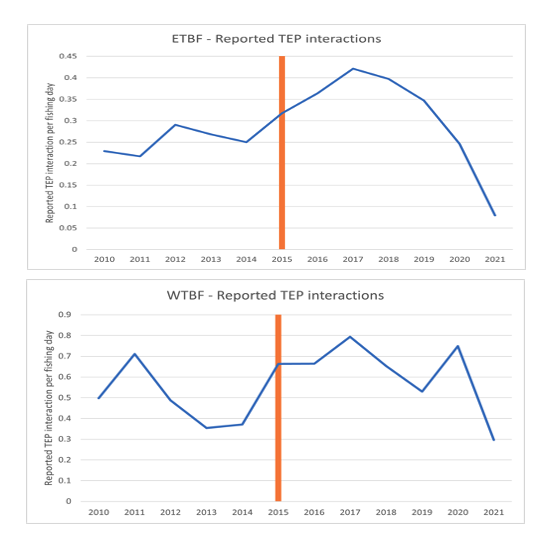
EM has proved an essential tool for monitoring interactions with protected species. The 2019 congruence analysis undertaken by ABARES demonstrated that, except for sharks, there was a significant increase in logbook reporting by fishers of all protected species interactions between non-EM and EM years (Figure 2). Similarly, AFMA monitors the protected species reporting. Figure 3 shows the protected species reporting in the ETBF and WTFB before and after the implementation of EM in 2015, shown by the orange line. Initially there was an increased reporting of the interactions enabling AFMA to review and amend the protected species mitigation and management arrangements. In the years following the implementation of these amended management arrangements, the reporting has remained very high (congruence with the logbook data confirms this), but there has been a demonstrable decline in protected species interactions and therefore associated reporting as mitigation measures have improved.
Management and compliance
EM has supported the implementation of more closely targeted management arrangements, for example, discrete spatial closures to reduce the risk of interactions with protected species such as Australian Sealions. EM has provided opportunities to understand vessel level differences in interactions and actively supported vessel level capacity building to improve the use and outcomes of mitigation strategies.
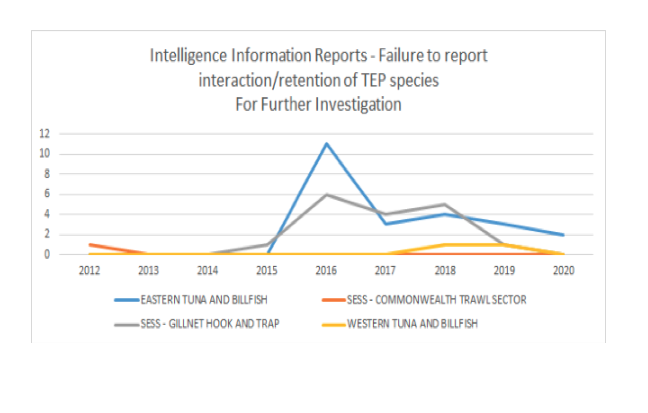
EM has supported better risk assessment and risk profiling for AFMA’s risk-based compliance program. EM has supported compliance planning and enabled better targeting of activities against the known risks in fisheries with EM. This contrasts with the broader approach to compliance planning in those fisheries without EM. AFMA’s compliance team has also demonstrated the implication of EM through time, with a clear reduction in reports of untoward behaviour, such as failing to report interactions with protected species (Figure 4).
Geolocation data
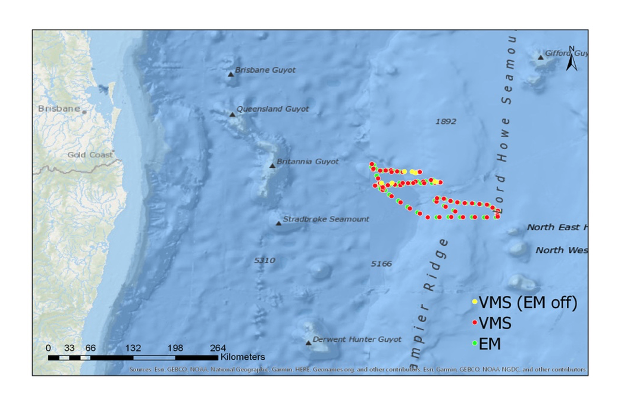
AFMA has demonstrated that geolocation data from EM systems can provide the same data as traditional vessel tracking using VMS. Of note was that using EM as the geolocation data source provided a more detailed understanding of vessel activities because of linked sensor feeds. AFMA’s compliance teams were able to clearly delineate ‘innocent passage’ from fishing event with the integrated sensor data on the GPS feed (Figure 5). AFMA is continuing to explore options of streamlining regulated technology requirements for fisheries management purposes.
AFMA’s Perspectives on the Benefits of EM
Over the past eight years, AFMA has demonstrated a range of benefits from the EM program. Although it is desirable to have a quantified cost-benefit analysis, this is difficult to achieve for an EM program. That said, there are quantified examples showing that EM has:
- Increased the accuracy of and confidence in logbook data
- Supported more targeted risk-based management arrangements, including the implementation of discrete spatial and temporal management arrangements
- Enabled compliance programs to target specific risks in a given fishery, rather than applying broad approaches
- Supported greater vessel-specific compliance programs
- Improved the ability to detect and address untoward behaviour, including the identification and rectification of previously unknown compliance issues
- Improved transparency between stakeholders including supporting more rigorous management discussions.
Decreasing uncertainty in fisheries data is paramount for stock assessments, for the implementation of harvest strategies, and for measuring the success of management measures. The demonstrated congruence between the EM data and logbooks has improved AFMA’s confidence in the accuracy of the logbook data being collected and has supported AFMA’s original supposition that EM can:
- Verify data collected by other monitoring tools; for AFMA is this logbook data including protected species logbook data, and
- Collect data that is also collected by other monitoring tools, suggesting that with improvements in artificial intelligence and machine learning there is a possibility of using EM as a primary data collection tool.
It is likely that the congruence analysis also supports AFMA’s 10% footage analysis rate as providing a good reflection of all logbook data. It is also likely to be affected by the EM coverage rate, the number of vessels with EM onboard in the fishery, and the random selection of the shots to be reviewed, however. AFMA’s EM program requires 100% EM coverage (with all vessels in the four fisheries required to have EM onboard) and conducts analysis on a random 10% of shots by boat.
These elements, combined with the known presence of EM on a vessel, impacts the behaviour of crew (e.g., logbook reporting). This is a well-known effect of surveillance referred to as the ‘camera effect’. Industry is aware that they are subject to EM analysis but are not aware of which shot from the trip will be analysed. The camera effect seems to result in more accurate logbook reporting across the fishery, which in turn is increasing the accuracy of all logbook data collected from the fishery generally and, importantly, for protected species interactions. Complete logbook reporting by fishers of their interactions enables more accurate estimates of total interactions, leading to more confidence in management and/or mitigation measures.
Independent and verified results obtained through EM are definitive and have been helpful in underpinning management conversations between stakeholders. In one instance, EM data has been instrumental in proving that certain fishery mitigation methods were effective and that the continued decline of the protected species was external to the fishing industry.
Critical for both management and compliance, behavioural changes resulting from the use of EM are long-lasting. Outcomes include more accurate data, increased confidence in the data underpinning management arrangements, and, with improved compliance, greater confidence in the effectiveness of management arrangements to achieve their objective. These effects in turn support the potential for more discrete and targeted management measures, rather than fishery wide management arrangements.
AFMA is an EM advocate, but also recognises that EM is not a panacea. EM is one in a suite of monitoring tools used by AFMA to manage and monitor fisheries and a one-size-fits-all approach to monitoring fisheries is no longer the best approach.
Essential to AFMA is that the data needed for fisheries management decisions drive the mix of monitoring tools to be used in the fishery. Use of EM will depend on the fishery and the monitoring objectives under consideration. The collection of biological data and/or samples is likely to remain under the remit of observer and port monitoring programs, while EM could replace the use of VMS as a geolocation tool in some fisheries.
EM programs are costly to plan and implement. AFMA’s EM program took significant time and resources to design, develop, and implement. Along with change-management and engagement with industry, a range of legislative, regulatory, policy, procedures and arrangements need to be developed to support the program. However, once established, the EM program has largely operated without significant oversight.
AFMA’s EM program is 100% cost-recovered from relevant industry sectors, so the benefits of EM need to be demonstrated and realised to maintain confidence in the program and broader management measures. Although costs remain an issue, industry is supportive of EM as a monitoring tool. It has provided accountability and transparency that were not as apparent with other such tools.
AFMA’s EM journey and the lessons learnt has identified the following key ingredients in a successful EM program:
- That the data needs of a fishery drive the design of the EM program, and that industry is a co-designer of the program’s design
- A requirement for 100% coverage, that is, that all fishing activities in the fishery are subject and captured by EM
- An audit approach for EM footage analysis, that is, that a random selection of total shots is selected for footage analysis
- Industry ownership of the EM systems to support ongoing maintenance of the systems including while at sea
- Regulations specifying the maintenance of the systems to ensure the collection of high-quality footage, for example a requirement for regular testing and cleaning and for vendors to provide rigorous services to industry, and
- Seeking to integrate and/or provide greater interoperability between the various monitoring tools required by fishers under the regulation.
###
Editor’s Note: This article is the second in a three-part series on electronic monitoring in Australian fisheries. We are indebted to Claire van der Geest, General Manager, Digital Transformation and Electronic Monitoring, with the Australian Fisheries Management Authority. Claire welcomes your questions or comments.
[1] Emery T. J.; Noriega, R.; Williams, A. J; Larcombe, J. (2019). Measuring the congruence between electronic monitoring and logbook data in Australian Commonwealth longline and gillnet fisheries. Ocean and Coastal Management, https://doi.org/10.1016/j.ocecoaman.2018.11.003.


